2020年の振り返り
世の中的には大変な一年だった。個人的にも停滞したなあ、というぼんやりとした感覚が残る一年だった。12 月に入ってからは原因が分からない無気力状態に陥ってしまい、何もできなかったのもあって余計にそう感じるのかもしれない。
趣味コーディング
相変わらず晩酌をしながらコードを書く時間が一番楽しい。すぐに気が散ってしまって込み入った思考ができないことが多く、今年は思ったような出力ができなかった。それでも可処分時間の大部分をコードを書くのに使っているのでやったことをつらつらと書いてみる。
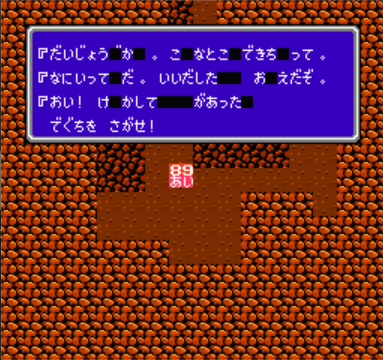
今年は主に NES エミュレータの完成度を上げていた。対応マッパーを増やしたり、VRC6とかの拡張音源をサポートしたりしていた。ステートセーブやエミュレーション速度変更などの機能も実装したので普通に遊べるレベルのものができた。自作のエミュレータで FF3 や悪魔城伝説をクリアできたのは良い思い出になった。副作用としてスーパーポテト秋葉原店に足繁く通うようになった。
minimp3 を Emscripten 依存無しで Wasm 化したりもしていた。これを使ってポッドキャスト再生 Web アプリを作ろうと思っていたけれど、作り始める前に WebCodecs が使えるようになってお役御免になるかもしれない。
去年作った Chrome Mojo IDL の Language Server を書き直して公開した。時間が取れたら async/await ベースで書き直すのと、最近追加された Semantic Tokens 対応をしたい。
ここ 1,2 か月はスーパーファミコンの音源を AudioWorklet として実装している。全く動かない日々が続いてしんどかったけれど、ようやくある程度音が出るようになった。Desktop PWA 化して作業中の BGM プレーヤとして使えるようにしたい。
最近の趣味コードはほとんど Rust で書いていて、だいぶ手になじんできた感じがある。
読書
去年の振り返りで読書量を増やしたいと書いていたけれど、今年もそんなに読めなかった。特に物語を読む時間をとるようにしたいなあ。
Snippets
日々の記録を取るのは継続できている。こうやって振り返りを書くときに便利だ。来年以降も続けていきたい。
仕事
三月の中旬ぐらいまでは会社へ行っていた。それ以後はずっと家からリモートワークしている。朝、昼、夕の決まった時間に散歩をするのを継続したので生活のリズムを保つことができた。これは良く機能したと思う。パッチ数や書いた design document の数といった出力だけみると生産性に大きな変化は無かったようだ。最初はかなり抵抗があったけれど、時間を柔軟に使えるし家から働くのもそんなに悪くないかもしれないと最近は思っている。ただでもオフィスが開いたら自分は出社するかな。家にずっといると retreat できる場所がなくて、それが結構ストレスになっている。年末に燃え尽きたのはこれが原因かもしれない。
仕事のやり方も変えていかないといけないなと感じているがこちらは上手くいっていない。これまでみたくオフラインでの議論は難しい。質問や分からないことがあったら、チャットを飛ばして即興の VC を始める、ぐらいのフットワークの軽さが必要だ。来年はここを改善したい。
春から夏にかけてインターンのホストをした。時間を無限に吸われて大変だったが、とても良い経験だった。自分のたどたどしい英語をインターンの学生さんが根気よく聞いてくれたおかげで、技術的に込み入った内容も少し説明できるようになってきた。付き合わせてしまった学生さんには申し訳ない気持ちもあるけれど、自分も学生さんの成長に少しは手助けできたかな、とも思っている。
プロジェクトとしては service workers のストレージ部分を out of process 化する、というのをずっとやっていた。このプロジェクトに対して自分は銀座線の改築みたいな感覚を持っている。自明で小さな変更を少しづつ加えていきつつ、最終的には大きな改修をする、といった感じ。実践できているかどうかは分からないけれど。年内に終わらせたかったが来年に持ち越してしまった。
英語
仕事で継続して使うので最低限のレベルは維持している。意思疎通するという意味では去年より上手くなったと思う。一方、昔覚えたけどあまり使わない単語や文法を忘れているのを実感することが多くなった。純粋な英語力は下がりつつあるけど運用や workaround でカバーしている感じ。
思えば 2018 年に通っていた英会話のレッスンは英語力向上にすごく役立った。あのときの反復練習で得た蓄積でやりくりしている実感がある。英会話レッスン、再開しようと思いつつ、腰が重くて再開できていない。
散歩
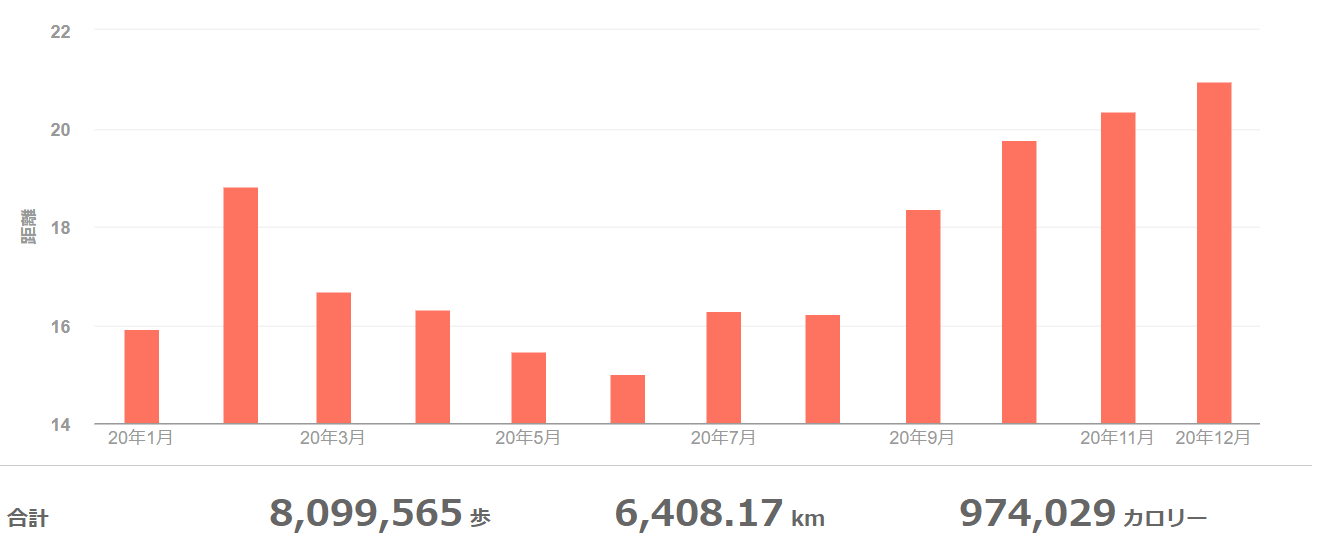
去年の秋ぐらいに Fitbit を買ったので記録が取れるようになった。今年は 800 万歩ぐらい歩いたらしい。人込みを避けた結果、早朝に長距離歩くようになった。
体型を維持しなければという強迫観念が強すぎるきらいがあるので少し歩く距離を減らそうと思っている。
来年の抱負
昨年と同じく細々としたものはやっているものの、難しいことをあんまりやれなかった一年だった。来年は難しいことを理解して出力することに時間を充てたい。
Frobbing - 2020/11/25
This week I tried not to see the Internet as much as I could.
I was reading a document that was written by a programmer back in late 2000. I came across a word which I didn’t know of. I’ve seen the word several times in the past years. I thought it’s a signal that I should know the meaning of the word. I searched the web.
The word was “frobbing.” The urban dictionary explains the word as “to spend time on a computer surfing the net.” Ths was what I was trying to avoid.
I felt the irony.
Aside: According to the Jargon File, “frob” also means to tweak. Tweak is one of the words I use frequently in commit messages. The document seemed to use the word in that sense.
5 PM - 2020/11/17
My desk is set up on the window side.
I was waiting for a long compile. I gazed absently out of the window. I saw a beautiful moon in the twilight.

2020/11/16
ホームレスの人たちを新鮮な目でとらえる意見を見聞きした。引っかかりを言葉として残す。
書かれた感想は見知らぬ人々の生活を目にした率直な反応だろう。
今の自分の住処はホームレスが多い地域だ。自分は日常的に彼らを目にする。彼らがどういう立ち振る舞いをするのかだいたい把握していると思う。おおなるほど、とか思うことは確かにある。でもそれはあくまで日常だ。冬の時期に道端に落ちている手袋を見つけて、おや?、みたいな、そんな感じに近い。
公園や河川敷を散歩していると、ときどき彼らに炊き出しをしている場面に遭遇する。写真撮影しないで欲しい、という看板を立てている。好奇の目にさらされるのを避けていると自分は理解した。
彼らをコンテンツとして消費していないか。大多数の彼らやその支援者はそれを望んでいないのに?違和感はそこからきている。
2020/11/12
I’m trying to decode SNES BRR.

The waveform above in the figure is the output of the library I’m referring to. The below is the output of mine.
Mine sounds like what it sounds, but I hear a lot of noises. The figure shows the difference clearly. The next step is to figure out where the noises come from.

Grafana + InfluxDB + Telegraf to monitor Raspberry Pi
I was planning to do spare-time programming this weekend but I couldn’t think straight so I did something different for a change.
Several weeks ago, I wrote a Prometheus exporter which records speedtest results. Currently it is running on a VM which lives in my desktop computer. I want to move the exporter to a Raspberry Pi 4 device.
Before moving the exporter, I thought it would be better to set up a nice visualization tool, not only for the exporter but metrics (CPU usage, tempurature etc) of the device. I searched the Web and Grafana looked a good candidate.
My initial attempt was to use Prometheus as a data source of device metrics, but I noticed that someone already created a nice dashboard for Raspberry Pi monitoring which doesn’t use prometheus.
I ended up following nicolargo/docker-influxdb-grafana.
Understanding and searching these tools (Grafana, InfluxDB and Telegraf) took some time, but all I had to do was writing a few configuration files to get the following dashboard. Now I understand why people say docker-compose is great.

2020/10/28
図書館が好きで足繫くとは言わないまでも月に数度は立ち寄っている。子供のころからの習慣が続いている。
テッド・チャン『息吹』を借りた。「ソフトウェア・オブジェクトのライフサイクル」を読む。rebuild.fm で紹介されていて気になっていた中編だ。面白い。ページをめくる。
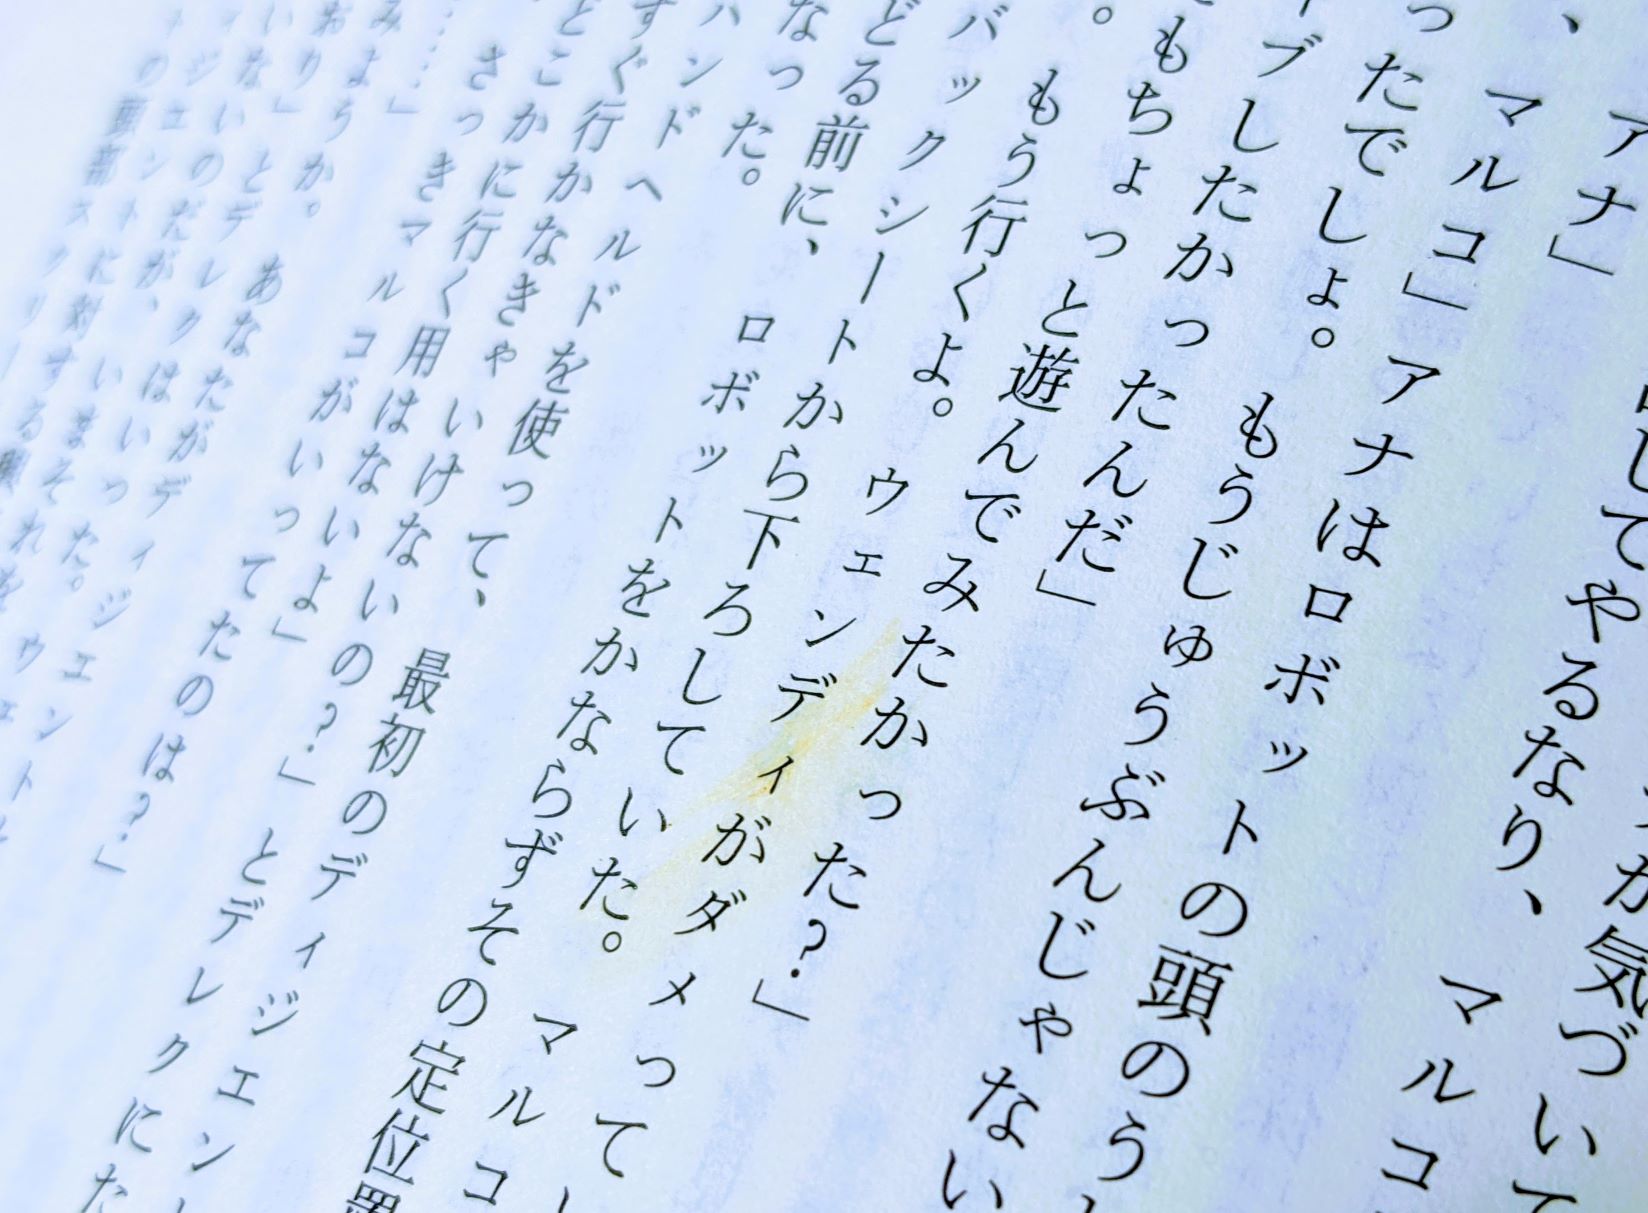
しみを見つけた。
これは前に借りた人がご飯を食べながら読んでいるときについたしみだろうか。今の自分みたいに。しみにはしっぽがついているから拭き取ろうとしたんだろう。ひと時のメタ認知が働く。
子供のころのように話に没頭することができない自分に気づく。
Q: How to limit the number of inflight async tasks in Rust?
Let’s say we want to have some concurrency for an async function in Rust. We want to execute the function thousands of times with different parameters (e.g. indexing many files). We also want to limit the number of inflight tasks so that the load on the system doesn’t exceed a certain level.
struct Task { /* ... */ }
struct TaskResult { /* ... */ }

async fn do_task(task: Task) -> Result<TaskResult> {
  // ...
}

const N: usize = 5;

async fn run_tasks(tasks: Vec<Task>) {
  // Q: How to limit the number of inflight tasks to N?
}
How would you do that?
I had no idea how to search the web for the question. After spending some time, a random search pointed out StreamExt::buffered().
Here is my current approach:
async fn run_tasks(tasks: Vec<Task>) {
  // Convert Vec<Task> to Vec<impl Future<Output=TaskResult>>
  let tasks = tasks.into_iter().map(|t| do_task(t));
  // Convert Vec<impl Future<Output=TaskResult>> to impl Stream<Item=TaskResult>
  let tasks = stream::iter(tasks);
  // Limit the number of tasks in the stream to consume at the same time.
  let tasks = tasks.buffered(N);
  while let Some(result) = tasks.next().await {
    // ...
  }
}
It worked but I guess that I’m wrong in the first place. Code is simple but I feel I’m doing something strange. I think it’s a common situation where we want to restrict the number of inflight tasks. I suspect that there is an idiomatic way to do that.
Half moon - 2020/11/02
I’m practicing developing photos. The moon was clearer than I thought. I didn’t use a tripod when I took the photo.
